
Statistical Inference via Data Science
A moderndive into R and the tidyverse
November 24, 2019
Preface
Special Announcement
We’re excited to announce that we’ve signed a book deal with CRC Press! We will be publishing our first fully complete online version of ModernDive in Summer 2019, with a corresponding print edition to follow in Fall 2019. Don’t worry though, our content will remain freely available on ModernDive.com.

This is a previous version (v0.6.1) of ModernDive and may be out of date. For the current version of ModernDive, please go to ModernDive.com.

Help! I’m new to R and RStudio and I need to learn about them! However, I’m completely new to coding! What do I do?
If you’re asking yourself this question, then you’ve come to the right place! Start with the “Introduction for students” section.
- Are you an instructor hoping to use this book in your courses? Then read the “Introduction for instructors” section for more information on how to teach with this book.
- Are you looking to connect with and contribute to ModernDive? Then read the “Connect and contribute” section for information on how.
- Are you curious about the publishing of this book? Then read the “About this book” section for more information on the open-source technology, in particular R Markdown and the bookdown package.
This is version 0.6.1 of ModernDive published on August 28, 2019. For previous versions of ModernDive, see the “About this book” section below.
Introduction for students
This book assumes no prerequisites: no algebra, no calculus, and no prior programming/coding experience. This is intended to be a gentle introduction to the practice of analyzing data and answering questions using data the way data scientists, statisticians, data journalists, and other researchers would.
We present a map of your upcoming journey in Figure 0.1.
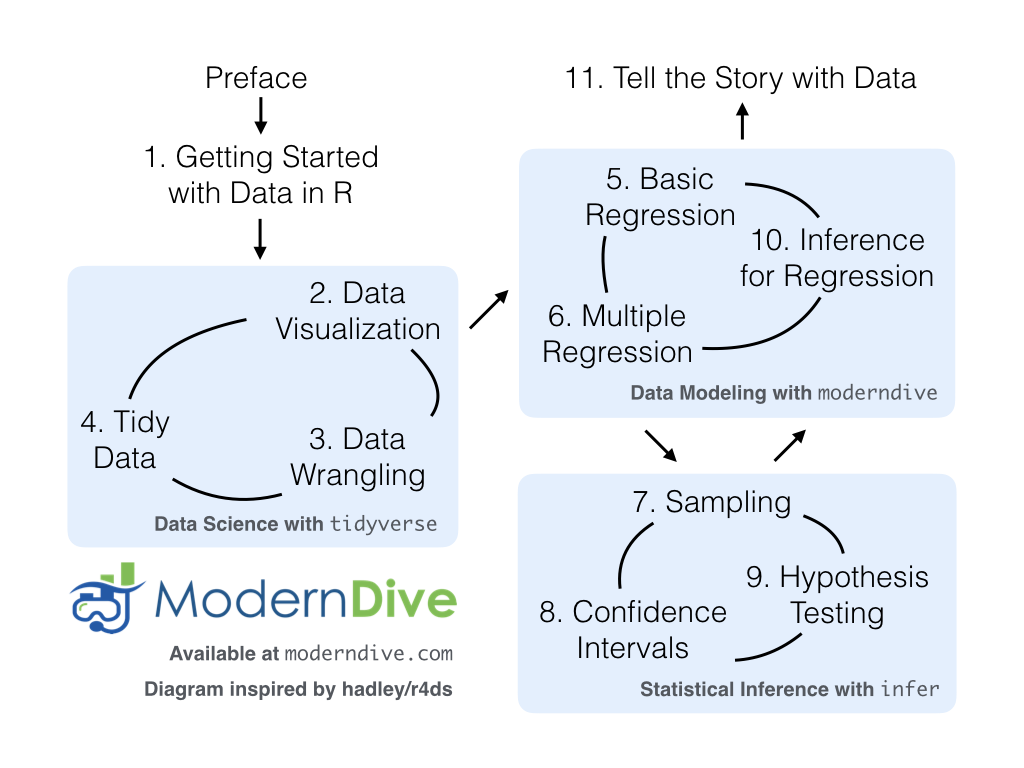
FIGURE 0.1: ModernDive Flowchart.
You’ll first get started with data in Chapter 1 where you’ll learn about the difference between R and RStudio, start coding in R, install and load your first R packages, and explore your first dataset: all domestic departure flights from a New York City airport in 2013. Then you’ll cover the following three portions of this book:
- Data science with
tidyverse. You’ll assemble your data science toolbox usingtidyversepackages. In particular you’ll- Ch.2: Visualize data using the
ggplot2package. - Ch.3: Wrangle data using the
dplyrpackage. - Ch.4: Learn about the concept of “tidy” data as a standardized data frame input and output format for all packages in the
tidyverse. Furthermore, you’ll learn how to import spreadsheet files into R using thereadrpackage.
- Ch.2: Visualize data using the
- Data modeling with
moderndive. Using these data science tools and helper functions from themoderndivepackage, you’ll fit your first data models. In particular: - Statistical inference with
infer. Once again using your newly acquired data science tools, you’ll unpack statistical inference using theinferpackage. In particular you’ll: - Data modeling with
moderndive(revisited): Armed with your understanding of statistical inference, you’ll revisit and review the models you’ll construct in Ch.5 & Ch.6. In particular you’ll:- Ch.10: Interpret confidence intervals and hypothesis tests in a regression setting.
We’ll end with a discussion on what it means to “tell the story with data” in Chapter 11 by presenting example case studies.
What we hope you will learn from this book
We hope that by the end of this book, you’ll have learned how to
- Use R and the
tidyversesuite of R packages for data science. - Fit your first models to data, using a method known as linear regression.
- Perform statistical inference using confidence intervals and hypothesis tests.
- Tell your story with data using these tools.
What do we mean by data stories? We mean any analysis involving data that engages the reader in answering questions with careful visuals and thoughtful discussion. Further discussions on data stories can be found in the blogpost “Tell a Meaningful Story With Data.”
Over the course of this book, you will develop your “data science toolbox,” equipping yourself with tools such as data visualization, data formatting, data wrangling, and data modeling using regression.
In particular, this book will lean heavily on data visualization. In today’s world, we are bombarded with graphics that attempt to convey ideas. We will explore what makes a good graphic and what the standard ways are used to convey relationships within data. In general, we’ll use visualization as a way of building almost all of the ideas in this book.
To impart the statistical lessons of this book, we have intentionally minimized the number of mathematical formulas used. Instead, you’ll develop a conceptual understanding of statistics using data visualization and computer simulations. We hope this is a more intuitive experience than the way statistics has traditionally been taught in the past and how it is commonly perceived.
Finally, you’ll learn the importance of literate programming. By this we mean you’ll learn how to write code that is useful not just for a computer to execute but also for readers to understand exactly what your analysis is doing and how you did it. This is part of a greater effort to encourage reproducible research (see the “Reproducible research” subsection for more details). Hal Abelson coined the phrase that we will follow throughout this book:
“Programs must be written for people to read, and only incidentally for machines to execute.”
We understand that there may be challenging moments as you learn to program. Both of us continue to struggle and find ourselves often using web searches to find answers and reach out to colleagues for help. In the long run though, we all can solve problems faster and more elegantly via programming. We wrote this book as our way to help you get started and you should know that there is a huge community of R users that are always happy to help everyone along as well. This community exists in particular on the internet on various forums and websites such as stackoverflow.com.
Data/science pipeline
You may think of statistics as just being a bunch of numbers. We commonly hear the phrase “statistician” when listening to broadcasts of sporting events. Statistics (in particular, data analysis), in addition to describing numbers like with baseball batting averages, plays a vital role in all of the sciences. You’ll commonly hear the phrase “statistically significant” thrown around in the media. You’ll see articles that say “Science now shows that chocolate is good for you.” Underpinning these claims is data analysis. By the end of this book, you’ll be able to better understand whether these claims should be trusted or whether we should be wary. Inside data analysis are many sub-fields that we will discuss throughout this book (though not necessarily in this order):
- data collection
- data wrangling
- data visualization
- data modeling
- inference
- correlation and regression
- interpretation of results
- data communication/storytelling
These sub-fields are summarized in what Grolemund and Wickham term the “Data/Science Pipeline” in Figure 0.2.
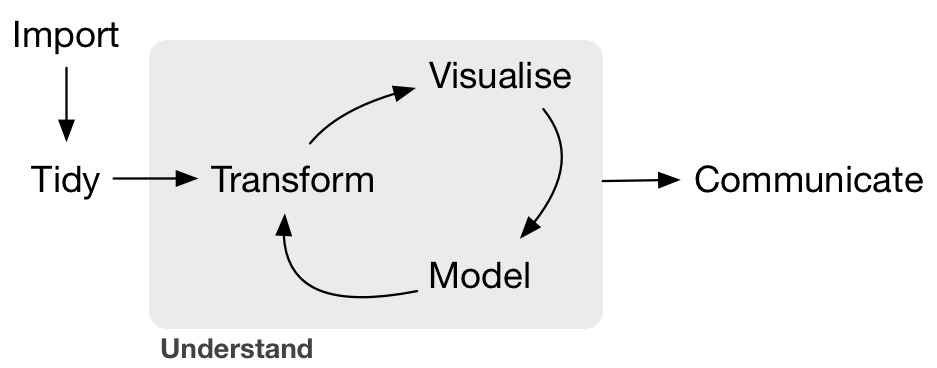
FIGURE 0.2: Data/Science Pipeline.
We will begin by digging into the gray Understand portion of the cycle with data visualization, then with a discussion on what is meant by tidy data and data wrangling, and then conclude by talking about interpreting and discussing the results of our models via Communication. These steps are vital to any statistical analysis. But why should you care about statistics? “Why did they make me take this class?”
There’s a reason so many fields require a statistics course. Scientific knowledge grows through an understanding of statistical significance and data analysis. You needn’t be intimidated by statistics. It’s not the beast that it used to be and, paired with computation, you’ll see how reproducible research in the sciences particularly increases scientific knowledge.
Reproducible research
“The most important tool is the mindset, when starting, that the end product will be reproducible.” – Keith Baggerly
Another goal of this book is to help readers understand the importance of reproducible analyses. The hope is to get readers into the habit of making their analyses reproducible from the very beginning. This means we’ll be trying to help you build new habits. This will take practice and be difficult at times. You’ll see just why it is so important for you to keep track of your code and well-document it to help yourself later and any potential collaborators as well.
Copying and pasting results from one program into a word processor is not the way that efficient and effective scientific research is conducted. It’s much more important for time to be spent on data collection and data analysis and not on copying and pasting plots back and forth across a variety of programs.
In traditional analyses if an error was made with the original data, we’d need to step through the entire process again: recreate the plots and copy-and-paste all of the new plots and our statistical analysis into your document. This is error prone and a frustrating use of time. We’ll see how to use R Markdown to get away from this tedious activity so that we can spend more time doing science.
“We are talking about computational reproducibility.” - Yihui Xie
Reproducibility means a lot of things in terms of different scientific fields. Are experiments conducted in a way that another researcher could follow the steps and get similar results? In this book, we will focus on what is known as computational reproducibility. This refers to being able to pass all of one’s data analysis, data-sets, and conclusions to someone else and have them get exactly the same results on their machine. This allows for time to be spent interpreting results and considering assumptions instead of the more error prone way of starting from scratch or following a list of steps that may be different from machine to machine.
Final note for students
At this point, if you are interested in instructor perspectives on this book, ways to contribute and collaborate, or the technical details of this book’s construction and publishing, then continue with the rest of the chapter. Otherwise, let’s get started with R and RStudio in Chapter 1!
Introduction for instructors
Resources
Here are some resources to help you use ModernDive:
- We’ve included review questions posed as Learning Checks. You can find all the solutions to all Learning Checks in Appendix D of the online version of the book at https://moderndive.com/D-appendixD.html.
- Dr. Jenny Smetzer and Albert Y. Kim have written a series of labs and problem sets. You can find them at https://moderndive.com/labs.
- You can see the webpages for two courses that use ModernDive:
- Smith College “SDS192 Introduction to Data Science”: https://rudeboybert.github.io/SDS192/.
- Smith College “SDS220 Introduction to Probability and Statistics” https://rudeboybert.github.io/SDS220/.
Why did we write this book?
This book is inspired by the following books:
- “Mathematical Statistics with Resampling and R” (Chihara and Hesterberg 2011),
- “OpenIntro: Intro Stat with Randomization and Simulation” (Diez, Barr, and Çetinkaya-Rundel 2014), and
- “R for Data Science” (Grolemund and Wickham 2016).
The first book, while designed for upper-level undergraduates and graduate students, provides an excellent resource on how to use resampling to impart statistical concepts like sampling distributions using computation instead of large-sample approximations and other mathematical formulas. The last two books are free options to learning introductory statistics and data science, providing an alternative to the many traditionally expensive introductory statistics textbooks.
When looking over the large number of introductory statistics textbooks that currently exist, we found that there wasn’t one that incorporated many newly developed R packages directly into the text, in particular the many packages included in the tidyverse collection of packages, such as ggplot2, dplyr, tidyr, and broom. Additionally, there wasn’t an open-source and easily reproducible textbook available that exposed new learners all of three of the learning goals we listed.
Who is this book for?
This book is intended for instructors of traditional introductory statistics classes using RStudio, either the desktop or server version, who would like to inject more data science topics into their syllabus. We assume that students taking the class will have no prior algebra, calculus, nor programming/coding experience.
Here are some principles and beliefs we kept in mind while writing this text. If you agree with them, this might be the book for you.
- Blur the lines between lecture and lab
- With increased availability and accessibility of laptops and open-source non-proprietary statistical software, the strict dichotomy between lab and lecture can be loosened.
- It’s much harder for students to understand the importance of using software if they only use it once a week or less. They forget the syntax in much the same way someone learning a foreign language forgets the rules. Frequent reinforcement is key.
- Focus on the entire data/science research pipeline
- We believe that the entirety of Grolemund and Wickham’s data/science pipeline should be taught.
- We believe in George Cobb’s “minimizing prerequisites to research”: students should be answering questions with data as soon as possible.
- It’s all about the data
- We leverage R packages for rich, real, and realistic data-sets that at the same time are easy-to-load into R, such as the
nycflights13andfivethirtyeightpackages. - We believe that data visualization is a gateway drug for statistics and that the Grammar of Graphics as implemented in the
ggplot2package is the best way to impart such lessons. However, we often hear: “You can’t teachggplot2for data visualization in intro stats!” We, like David Robinson, are much more optimistic. dplyrhas made data wrangling much more accessible to novices, and hence much more interesting data-sets can be explored.
- We leverage R packages for rich, real, and realistic data-sets that at the same time are easy-to-load into R, such as the
- Use simulation/resampling to introduce statistical inference, not probability/mathematical formulas
- Instead of using formulas, large-sample approximations, and probability tables, we teach statistical concepts using resampling-based inference.
- This allows for a de-emphasis of traditional probability topics, freeing up room in the syllabus for other topics. Bridges to these mathematical concepts are given as well to help with relation of these traditional topics with more modern approaches.
- Don’t fence off students from the computation pool, throw them in!
- Computing skills are essential to working with data in the 21st century. Given this fact, we feel that to shield students from computing is to ultimately do them a disservice.
- We are not teaching a course on coding/programming per se, but rather just enough of the computational and algorithmic thinking necessary for data analysis.
- Complete reproducibility and customizability
- We are frustrated when textbooks give examples, but not the source code and the data itself. We give you the source code for all examples as well as the whole book!
- Ultimately the best textbook is one you’ve written yourself. You know best your audience, their background, and their priorities. You know best your own style and the types of examples and problems you like best. Customization is the ultimate end. For more about how to make this book your own, see About this Book.
Connect and contribute
If you would like to connect with ModernDive, check out the following links:
- If you would like to receive periodic updates about ModernDive (roughly every 6 months), please sign up for our mailing list.
- Contact Albert at albert.ys.kim@gmail.com and Chester at chester.ismay@gmail.com.
- We’re on Twitter at moderndive.
If you would like to contribute to ModernDive, there are many ways! We would love your help and feedback to make this book as great as possible! For example, if you find any errors, typos, or areas for improvement, then please email us or post an issue on our GitHub issues page. If you are familiar with GitHub and would like to contribute more, please see the “About this book” section.
The authors would like to thank Nina Sonneborn, Kristin Bott, Dr. Jenny Smetzer, and the participants of our 2017 and 2019 USCOTS workshops for their feedback and suggestions. We’d also like to thank Dr. Andrew Heiss for contributing Subsection 1.2.3 on “Errors, warnings, and messages.” and Starry Zhou for her many edits to the book. A special thanks goes to Dr. Yana Weinstein, cognitive psychological scientist and co-founder of The Learning Scientists, for her extensive feedback.
About this book
This book was written using RStudio’s bookdown package by Yihui Xie (Xie 2019). This package simplifies the publishing of books by having all content written in R Markdown. The bookdown/R Markdown source code for all versions of ModernDive is available on GitHub:
- Latest published version The most up-to-date release:
- Version 0.6.1 released on August 28, 2019 (source code).
- Available at ModernDive.com
- Development version The working copy of the next version which is currently being edited:
- Preview of development version is available at https://moderndive.netlify.com/
- Source code: Available on ModernDive’s GitHub repository page
- Previous versions Older versions that may be out of date:
- Version 0.5.0 released on February 24, 2019 (source code)
- Version 0.4.0 released on July 21, 2018 (source code)
- Version 0.3.0 released on February 3, 2018 (source code)
- Version 0.2.0 released on August 02, 2017 (source code)
- Version 0.1.3 released on February 09, 2017 (source code)
- Version 0.1.2 released on January 22, 2017 (source code)
Could this be a new paradigm for textbooks? Instead of the traditional model of textbook companies publishing updated editions of the textbook every few years, we apply a software design influenced model of publishing more easily updated versions. We can then leverage open-source communities of instructors and developers for ideas, tools, resources, and feedback. As such, we welcome your pull requests.
Finally, feel free to modify the book as you wish for your own needs, but please list the authors at the top of index.Rmd as “Chester Ismay, Albert Y. Kim, and YOU!”
About the authors
Who we are!
| Chester Ismay | Albert Y. Kim |
|---|---|
 |
 |
- Chester Ismay: Data Science Evangelist - DataRobot, Portland, OR, USA.
- Email: chester.ismay@gmail.com
- Webpage: http://chester.rbind.io/
- Twitter: old_man_chester
- GitHub: https://github.com/ismayc
- Albert Y. Kim: Assistant Professor of Statistical & Data Sciences - Smith College, Northampton, MA, USA.
- Email: albert.ys.kim@gmail.com
- Webpage: http://rudeboybert.rbind.io/
- Twitter: rudeboybert
- GitHub: https://github.com/rudeboybert
References
Chihara, Laura M., and Tim C. Hesterberg. 2011. Mathematical Statistics with Resampling and R. Hoboken, NJ: John Wiley; Sons. https://sites.google.com/site/chiharahesterberg/home.
Diez, David M, Christopher D Barr, and Mine Çetinkaya-Rundel. 2014. Introductory Statistics with Randomization and Simulation. First Edition. https://www.openintro.org/stat/textbook.php?stat_book=isrs.
Grolemund, Garrett, and Hadley Wickham. 2016. R for Data Science. http://r4ds.had.co.nz/.
Xie, Yihui. 2019. Bookdown: Authoring Books and Technical Documents with R Markdown. https://CRAN.R-project.org/package=bookdown.