2 Introduction
2.1 Preamble
This book is inspired by three books:
- “Mathematical Statistics with Resampling and R” (Chihara and Hesterberg 2011),
- “Intro Stat with Randomization and Simulation” (Diez, Barr, and Çetinkaya-Rundel 2014), and
- “R for Data Science” (Grolemund and Wickham 2016).
The first book, while designed for upper-level undergraduates and graduate students, provides an excellent resource on how to use resampling to build statistical concepts like normal distributions using computers instead of focusing on memorization of formulas. The last two books also provide a path towards free alternatives to the traditionally expensive introductory statistics textbook. When looking over the vast number of introductory statistics textbooks, we found that there wasn’t one that incorporated many of the new R packages directly into the text. Additionally, there wasn’t an open-source, free textbook available that showed new learners all of the following
- how to use R to explore and visualize data
- how to use randomization and simulation to build inferential ideas
- how to effectively create stories using these ideas to convey information to a lay audience.
We will introduce sometimes difficult statistics concepts through the medium of data visualization. In today’s world, we are bombarded with graphics that attempt to convey ideas. We will explore what makes a good graphic and what the standard ways are to convey relationships with data. You’ll also see the use of visualization to introduce concepts like mean, median, standard deviation, distributions, etc. In general, we’ll use visualization as a way of building almost all of the ideas in this book.
Additionally, this book will focus on the triad of computational thinking, data thinking, and inferential thinking. We’ll see throughout the book how these three modes of thinking can build effective ways to work with, to describe, and to convey statistical knowledge. In order to do so, you’ll see the importance of literate programming to develop literate data science. In other words, you’ll see how to write code and descriptions that are useful not just for a computer to execute but also for readers to understand exactly what a statistical analysis is doing and how it works. Hal Abelson coined the phrase that we will follow throughout this book:
“Programs must be written for people to read, and only incidentally for machines to execute.”
2.2 Three driving data sources
Instead of hopping from one data set to the next in the text of this book, we’ve decided to focus throughout on three different data sources:
- flights leaving New York City in 2013
- profiles of OKCupid users in San Francisco
- IMDB movie ratings
By focusing on just three large data sources, it is our hope that you’ll be able to see how each of the chapters is interconnected. You’ll see how the data being tidy leads into data visualization and manipulation in exploratory data analysis and how those concepts tie into inference and regression.
2.3 Data/science pipeline
You may think of statistics as just being a bunch of numbers. We commonly hear the phrase “statistician” when listening to broadcasts of sporting events. Statistics (in particular, data analysis), in addition to describing numbers like with baseball batting averages, plays a vital role in all of the sciences. You’ll commonly hear the phrase “statistically significant” thrown around in the media. You’ll see things that say “Science now shows that chocolate is good for you.” Underpinning these claims is data analysis. By the end of this book, you’ll be able to better understand whether these claims should be trusted or whether we should be weary. Inside data analysis are many sub-fields that we will discuss throughout this book (not necessarily in this order):
- data collection
- data manipulation
- data visualization
- data modeling
- inference
- correlation and regression
- interpretation of results
- data storytelling
This can be summarized in a graphic that is commonly used by Hadley Wickham:
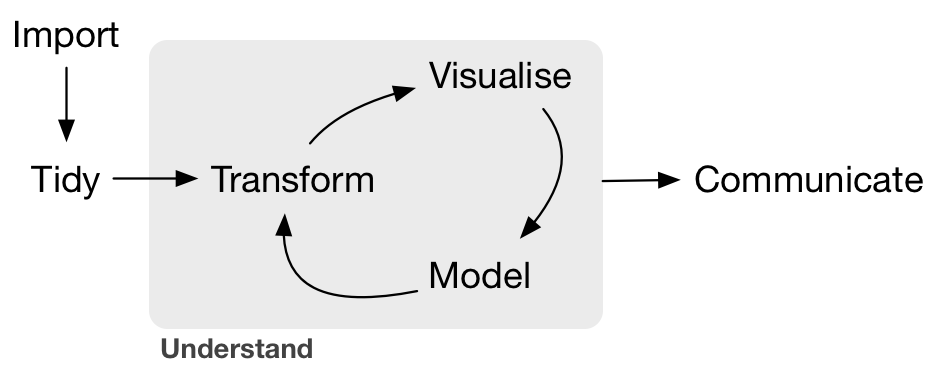
Figure 2.1: Hadley’s workflow graphic
We will begin with a discussion on what is meant by tidy data and then dig into the gray Understand portion of the cycle and conclude by talking about interpreting and discussing the results of our models via Communication. These steps are vital to any statistical analysis. But why should you care about statistics? “Why did they make me take this class?”
There’s a reason so many fields require a statistics course. Scientific knowledge grows through an understanding of statistical significance and data analysis. You needn’t be intimidated by statistics. It’s not the beast that it used to be and, paired with computation, you’ll see how reproducible research in the sciences particularly increases scientific knowledge.
2.4 Reproducibility
“The most important tool is the mindset, when starting, that the end product will be reproducible.” – Keith Baggerly
Another large goal of this book is to help readers understand the importance of reproducible analyses. The hope is to get readers into the habit of making their analyses reproducible from the very beginning. This means we’ll be trying to help you build new habits. This will take practice and be difficult at times. You’ll see just why it is so important for you to keep track of your code and well-document it to help yourself later and any potential collaborators as well.
Copying and pasting results from one program into a word processor is not the way that efficient and effective scientific research is conducted. It’s much more important for time to be spent on data collection and data analysis and not on copying and pasting plots back and forth across a variety of programs.
In a traditional analyses if an error was made with the original data, we’d need to step through the entire process again: recreate the plots and copy and paste all of the new plots and our statistical analysis into your document. This is error prone and a frustrating use of time. We’ll see how to use R Markdown to get away from this tedious activity so that we can spend more time doing science.
“We are talking about computational reproducibility.” - Yihui Xie
Reproducibility means a lot of things in terms of different scientific fields. Are experiments conducted in a way that another researcher could follow the steps and get similar results? In this book, we will focus on what is known as computational reproducibility. This refers to being able to pass all of one’s data analysis, data sets, and conclusions to someone else and have them get exactly the same results on their machine. This allows for time to be spent doing actual science and interpreting of results and assumptions instead of the more error prone way of starting from scratch or following a list of steps that may be different from machine to machine.
2.5 Who is this book for?
This book is targeted at students taking a traditional intro stats class in a small college environment using RStudio and preferably RStudio Server. We assume no prerequisites: no algebra, no calculus, and no prior programming experience. This is intended to be a gentle and nice introduction to the practice of statistics in terms of how data scientists, statisticians, data journalists, and other scientists analyze data and write stories about data. We have intentionally avoided the use of throwing formulas at you as much as possible and instead have focused on developing statistical concepts via data visualization and statistical computing. We hope this is a more intuitive experience than the way statistics has traditionally been taught in the past (and how it is commonly perceived from the outside). We additionally hope that you see the value of reproducible research via R as you continue in your studies. We understand that there will initially be growing pains in learning to program but we are here to help you and you should know that there is a huge community of R users that are always happy to help newbies along as well.
Now let’s get into learning about how to create good stories about and with data!
References
Chihara, Laura M., and Tim C. Hesterberg. 2011. Mathematical Statistics with Resampling and R. Hoboken, NJ: John Wiley; Sons. https://sites.google.com/site/chiharahesterberg/home.
Diez, David M, Christopher D Barr, and Mine Çetinkaya-Rundel. 2014. Introductory Statistics with Randomization and Simulation. First Edition. https://www.openintro.org/stat/textbook.php?stat_book=isrs.
Grolemund, Garrett, and Hadley Wickham. 2016. R for Data Science. http://r4ds.had.co.nz/.